

Research / Commentary
Financing defence for growth and resilience: multipliers, multilateral banks, and the structure of collective security finance
↓ Download PDF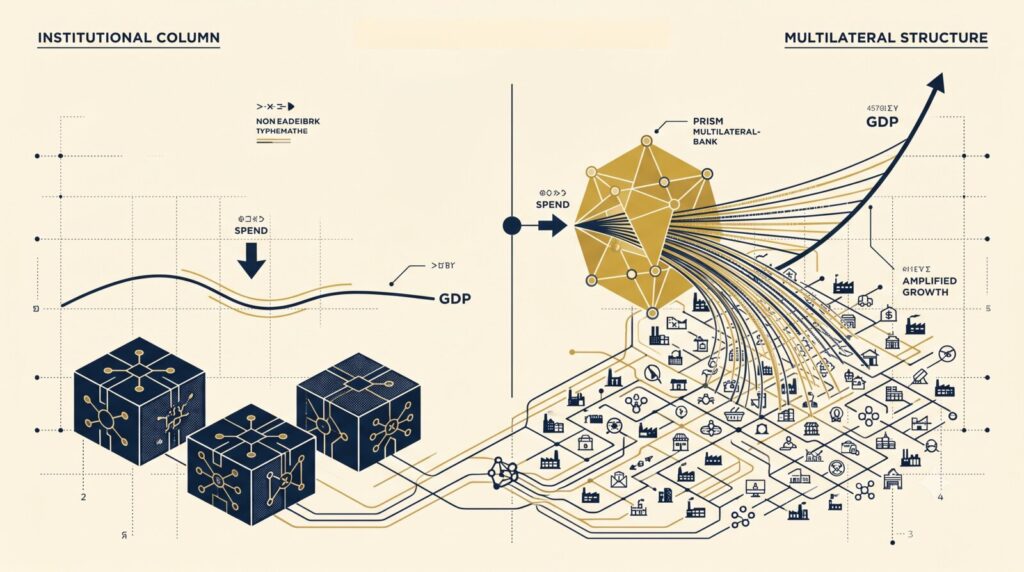

Defence spending alone has modest and short-lived effects on growth. Dr. Rebecca Harding on why the STRUCTURE of defence finance — pooled sovereign equity, MDB leverage, guarantees to SME supply chains — is what turns spending into sustained resilience.
Dr. Rebecca Harding — CEO, Centre for Economic Security
A briefing note on multipliers, multilateral banks, and the structure of collective security finance.
Executive Summary
Defence budgets are rising sharply across NATO and partner nations, with a collective commitment to spend around 5% of GDP on military operations, procurement, and security and resilience infrastructure. This note examines whether increased spending alone delivers economic growth, or whether the structure of that spending is more important.
The evidence from the literature is clear: spending alone has modest and short-lived effects. Academic studies of defence multipliers find that an additional 1% of GDP in defence outlays typically raises output by only 0.4–0.8% in the short run, fading to near zero after five years. When funds are directed to wages or imported equipment, effects are even weaker.
By contrast, when spending is structured through multilateral financial institutions, outcomes are stronger and more persistent. Multilateral development banks (MDBs) pool sovereign equity, leverage it many times over, and crowd in private finance. Their impact assessments show that investments in infrastructure and industry can lift GDP by 1–2% over a decade. Applied to defence, this structure means that relatively small sovereign contributions (≈0.3–0.5% of GDP) can support effective financing envelopes of 8–10% of GDP by year five.
The comparison of models illustrates the point:
- SAFE national funds deliver fast finance but add to debt, producing the weakest and least durable multipliers.
- Eurobonds (Bruegel model) reduce borrowing costs but do not reform procurement, so effects remain modest.
- The European Rearmament Bank (ERB) enforces pooled procurement, raising short- run multipliers, but its impact fades as liquidity remains concentrated on prime level corporates.
- The Defence, Security and Resilience Bank (DSRB) combines sovereign pooling with supply-chain guarantees, mobilising private capital and supporting SMEs. It sustains growth effects into the medium and long term, lifting GDP by 1.5–2% in the central case and up to 3–4% under ambitious scenarios after a decade.
Conclusion: Defence spending is not a growth engine in itself. But when channelled through a multilateral bank that pools capital, conditions procurement, and supports supply chains, it becomes a modest but real contributor to long-term growth and resilience. The DSRB model in particular offers the broadest and most persistent economic benefits.
1. Introduction
Across NATO and its partners, defence spending is rising faster than at any time since the Cold War. Commitments to raise expenditure toward 5% of GDP - 3.5% on military operations and procurement, 1.5% on security and resilience infrastructure - are giving rise to a burgeoning literature on the growth effects of all this additional defence spending with a focus, not just how much is spent but also how it is spent.
The purpose of this note is to review selected contributions to that literature and test the central proposition that defence spending in itself has a limited effect on GDP and GVA against this literature. Traditional economic estimates suggest multipliers of 0.4–0.8 for advanced economies meaning that each dollar of spending adds less than a dollar to GDP in the short run. In some cases, especially when funds go to wages or imported equipment, the impact may be close to zero.
Rather, the note argues that the way defence spending is structured makes all the difference to the economic impacts that spending will have. When a proportion of such increased spending is channelled through multilateral financial institutions (MFIs) with pooled sovereign credit and supply-chain guarantees, the effects are larger, more persistent, and more likely to deliver long-run productivity gains.
This briefing note reviews the evidence, sets out comparative results across financing models, and draws policy lessons for NATO allies.
2. Methodology and literature summary
The approach to assessing the economic impact of defence finance rests on three strands of evidence.1
The first is the literature on defence spending multipliers. A long tradition of macroeconomic studies has attempted to quantify how much GDP rises when governments increase defence budgets. Classic U.S. studies (Barro and Redlick, 2011; Ramey and Zubairy,
Note – more articles were surveyed than are listed here but these were the strongest in driving the GDP estimations
2018; Hall, 2009) typically place short-run multipliers in the 0.4–0.8 range, with higher values in conditions of slack or when spending is tilted to capital investment rather than personnel. More recent work has disaggregated the effects: Becker and Dunne (2023) find that personnel and operating expenditures tend to depress growth, while procurement and R&D are more supportive; Olejnik (2023) estimates multipliers of 0.6 on impact, peaking at 1.5–1.6 in Central and Eastern Europe before fading; and SUERF (2025) highlights the importance of openness, showing multipliers from 0.6 to 2.4 depending on trade leakages. Methodological cautions are offered by Moura (2015) and Geli and Moura (2023), who show context-related bias can overstate results. For the Baltic states specifically, Dudzevičiūtė (2023) finds a strong dependence of defence funding on GDP per capita and debt levels, reinforcing the need to account for macro conditions. Together, this literature provides the baseline coefficients applied to additional one-off spending “shocks” in a simple momentum growth model.
The second strand is the evidence on multilateral development banks (MDBs) and development finance institutions (DFIs). These institutions differ from national spending in that they pool sovereign capital, leverage it into much larger volumes, and mobilise private investment alongside. The empirical literature consistently finds positive growth effects. Massa (2011) shows that a 10% increase in multilateral DFI commitments is associated with a 0.9–1.3% increase in GDP, with especially strong results in infrastructure and industry. Haini (2020) finds that financial development and institutional quality are complementary, amplifying the growth impact of MDB finance. Studies of newer MDBs provide further insight: Sithole and Hlongwane (2023) highlight the role of the New Development Bank in BRICS economies; Hofman and Srinivas (2024) assess its evolving governance; Köstem and Metintaş (2024) show how MDBs shape Eurasian connectivity through infrastructure and energy corridors; and Evans and Davies (2015) underline the World Bank’s role in global public goods. The 2023 Joint MDB Report confirms that MDBs collectively mobilise tens of billions annually in private finance, while the 2024 EBRD Impact Report documents spillovers into competitiveness, green transition, and resilience. Together, these findings underpin our assumption that MDB-style structures not only raise multipliers in the short run but sustain them over a decade or more by crowding in private capital and embedding supply-chain resilience.
The third strand is the comparative analysis of financing models currently proposed for collective defence. Here we draw directly on the policy design papers. The SAFE-style national funds are described in the Centre for Economic Security’s Towards a Defence Spending Model (CES, 2025). The Bruegel/Eurobond proposals are summarised in Collective Defence Finance: Towards a Financing Architecture for Collective Defence (Collective Defence Finance Group, 2025). The European Rearmament Bank is set out in FAQ v17: Concept Paper (de Selliers, Carter, Lucas, 2025), while the Defence, Security & Resilience Bank (DSRB) is presented in the DSRB two-pager by Harding, Murray, Peach and Boyd (2025)
and Murray’s 2024 Atlantic Council policy document. These documents provide the capitalisation paths, leverage assumptions, and institutional structures that we apply in our scenarios. Unlike SAFE and Eurobond approaches, which are essentially debt instruments, the ERB and DSRB treat contributions as equity assets, enabling them to be leveraged many times over while avoiding negative debt optics. The DSRB in particular extends guarantees into the deep tiers of the supply chain, a feature absent from the ERB design, and thus represents the most comprehensive model for sustaining growth effects.
By combining these three strands — multiplier estimates from defence spending, growth impacts from MDBs, and the capitalisation structures of the proposed models — we are able to present the effects on GDP and GVA on economies generally and countries and country groupings in the short-, medium-, and long-run under three scenario types: conservative, central, and ambitious scenarios. A full technical method is given in Appendix
3. Comparative Analysis of Financing Models
The central proposition of this note is that the way defence finance is organised matters at least as much as the volume of money committed. Four main models are on the table at the time of writing to address the issues of collective defence financing: national facilities such as SAFE, the Eurobond proposals developed by Bruegel and others, the European Rearmament Bank (ERB), and the Defence, Security and Resilience Bank (DSRB). Each mixes tax, debt, and government investment in different ways, and each carries distinct implications for GDP and GVA.
Applying the assumptions of financing growth implicit in the analysis of defence spending corroborates the idea that the structure of financing is important.
First, the SAFE-style funds are essentially national arrangements. Governments earmark resources, sometimes off-balance sheet, to finance additional procurement. Although politically expedient and fast to establish, they have two disadvantages. First, they sit squarely as sovereign debt, raising concerns in bond markets and limiting fiscal space. Second, they fragment the financing effort across nations. Each country pays more for its borrowing than it would under a pooled structure, and there is little incentive to reform procurement practices. As a result, SAFE facilities tend to produce the lowest multipliers. Short-run effects may be in the 0.3–0.7 range, but they fade quickly as debt optics worsen and supply-side bottlenecks remain unresolved.
Second, the Eurobond concept, promoted by Bruegel and others as a European Defence Mechanism, takes one step further. By issuing joint debt backed by multiple sovereigns, Eurobonds reduce borrowing costs and relieve immediate fiscal pressures. For countries such as Italy, this matters enormously. Yet Eurobonds by themselves are financing
instruments, not reforming ones. They make it cheaper to borrow but do not change how the money is spent. Without conditionality on procurement, the risk of duplication remains high and the benefits to supply-chain liquidity are minimal. In GDP terms, Eurobonds might produce 0.8–1.2 multipliers in the short run, but these advantages fade as projects are delivered under the old, nationally fragmented procurement model.
Third, the European Rearmament Bank (ERB) offers a more structural approach. Based on paid-in capital leveraged through AAA-rated bonds, the ERB ties its lending to purchase orders and insists on procurement reform. This is a real advantage: pooled orders, open architectures, and interoperability standards lower costs and improve delivery. The ERB model therefore tackles inefficiency in procurement head-on. Its limitation, however, is on the supply side. By focusing on prime contractors and first-tier suppliers, the ERB’s structures are not configured to relieve the liquidity constraints facing the smaller firms deeper in the chain, for example through guarantees or supply chain finance. These are precisely the companies most at risk of insolvency when demand surges. For GDP, this means ERB-financed programmes can lift multipliers to around 1.0–1.5 in the short run, but persistence is weaker since bottlenecks in the industrial base are not removed. Thus over the longer term, these effects fade.
The Defence, Security and Resilience Bank (DSRB) is the broadest and deepest model because it is configured as a Multilateral Development Bank. Like the ERB, it pools sovereign capital into an AAA-rated vehicle and lends against government procurement. Unlike the ERB, it also provides guarantees to commercial banks so that liquidity flows into the second, third, and even fourth tiers of supply. This dual focus — demand at the sovereign level, supply at the SME level — is what makes the DSRB distinctive. By mobilising private investors alongside government contributions, the DSRB ensures that capital reaches not only the primes but also the innovators, subcontractors, and specialist suppliers on which modern defence capability depends. As a result, GDP and GVA effects are not only higher in the short run, in the 1.2–1.5 range, but also more persistent: central estimates suggest an additional 2% GDP after a decade, rising to 3–4% under ambitious assumptions if procurement is geared toward dual-use R&D.
The comparison is instructive. SAFE funds are quick but fiscally burdensome, and they generate the weakest growth effects. Eurobonds ease borrowing costs but do not change procurement behaviour. The ERB is more disciplined, reducing duplication and enforcing best practice, but leaves supply-chain liquidity largely untouched. The DSRB integrates both sides of the problem, tackling fiscal optics, procurement inefficiency, and industrial bottlenecks together. Its growth and GVA effects are therefore both larger and longer- lasting.
Table 1 presents the financing structures of each model including how they are treated in national accounts and their core challenges.
| Model | Financing mix | National accounts treatment | Structural features | Challenges |
|---|---|---|---|---|
| SAFE | Sovereign borrowing (tax + debt) | Adds to national debt | Fast access to funds | Fragmented, limited crowd-in, fiscal penalties |
| Bruegel/Eurobond | Collective debt issuance | Shared liability; reduces spreads | Stabilises markets; macro instrument | Weak procurement conditionality; leakages remain |
| ERB | Paid-in capital leveraged with AAA bonds | Equity contributions; loans tied to orders | Enforces pooled procurement; lowers costs | Liquidity concentrated at Tier-1; SMEs underserved |
| DSRB | Equity + AAA leverage + supply-chain guarantees | Equity treated as asset; guarantees channel private capital | Addresses demand and supply; deep-tier liquidity | More complex to set up; requires broad political buy-in |
4. Results
The question at the heart of this note is how much defence spending contributes to GDP and GVA, and how much difference the financing structure makes. The evidence points strongly to two conclusions: first, that the growth effects of defence spending alone are modest and short-lived; but second, when spending is structured through multilateral financing models the effects are larger, more persistent, and more fiscally sustainable.
To capture this, we present the results through two complementary lenses:
- Standardised estimates, based on the familiar benchmark of a +1% of GDP spending one-off shock. These make our findings directly comparable with the academic literature. 2. Scaled model estimates, which apply those multipliers to the actual capitalisation and leverage paths proposed for the SAFE, Bruegel Eurobond, ERB, and DSRB models. This grounds the analysis in policy reality.
4.1 Defence multipliers on their own
The literature on defence multipliers shows wide variation but shares a common theme. Short-run GDP effects in advanced economies tend to fall between 0.4 and 0.8. In Europe, where much procurement is imported, the impact is often closer to the lower bound. Becker and Dunne show that growth effects are negative when personnel and operating costs dominate budgets, while Olejnik’s study of Central and Eastern Europe finds that multipliers rise briefly to 1.5 in years two to three before fading back toward zero. SUERF’s survey suggests that under the best conditions — fixed exchange rates, slack in the economy, domestic procurement — multipliers can approach 2-times. But these conditions are rare.
4.1.1 Standardised 1% of GDP Spending Shock
The first perspective mirrors the academic literature. It assumes that every country raises defence spending by 1% of GDP, financed through borrowing on a one-off or “shock” basis.
| Horizon | Conservative | Central | Ambitious |
|---|---|---|---|
| Short run (1–2 years) | +0.3–0.7% GDP | +1.0–1.4% GDP | +1.4–1.8% GDP |
| Medium run (3–5 years) | +0.4–0.9% | +1.5% | +2.0–2.8% |
| Long run (10 years) | ≈0 | +1–2% | +3–4% |
Without structural reform in an economy, the literature suggests that the conservative case of the impact of defence spending increases produces only modest gains in the short term and then fade within five years. This is because the economic system does not adjust to the increases in spending over the longer term – capacity is not built and the effect is to continue to pull in imports.
The message is clear: “money in” does not automatically mean “growth out” over the long term, The way spending is financed and directed makes the difference between a temporary fiscal sugar-rush and a lasting investment in resilience.
4.1.2 Scaled Model Comparison (SAFE, Bruegel, ERB, DSRB)
The second perspective applies these multipliers to the actual financing envelopes of the four main models under consideration. Here, we move beyond a stylised shock and ask: if countries capitalise the ERB or DSRB as proposed, how large an economic effect should we expect? In essence, this is examining the assumption that with multilateral financing and conditional procurement, as in the central and ambitious cases, the supply side can adapt. In other words, multipliers should be larger and persist into the medium and long run.
Table 3 examines the four alternative financing models, how they are funded by sovereigns, the role of leveraging in private capital and the implicit increase in defence spending this combination of public and private capital yields. The final column of the table highlights the treatment of capital allocation to each model as either a contribution to national debt or as an asset on the national balance sheet.
| Model | Sovereign contribution | Leverage / mobilisation | Effective financing capacity (% GDP by year 5) | Treatment in accounts |
|---|---|---|---|---|
| SAFE | ≈1% GDP annually | None | 3–5% GDP | Current spending, adds to debt |
| Bruegel/Eurobond | N/A (joint debt issuance) | None | 1–2% GDP per year | Shared debt liability |
| ERB | 0.25–0.5% GDP over 3 yrs | 20–25× leverage | 5–7% GDP | Paid-in equity (asset); loans tied to orders |
| DSRB | 0.3–0.5% GDP over 3 yrs | 20–25× leverage + guarantees + crowd-in | 8–10% GDP | Equity (asset) + private mobilisation |
Applying the specific features of each model to GDP estimates using the central case assumption is illustrated in Table 4. The multilateral solutions yield higher returns of potentially up to 4% GDP increases in the long run with the DSRB performing the best over a ten year time period:
- SAFE funds provide rapid finance but carry the weakest growth effects, because they sit as debt and do not change procurement.
- Bruegel Eurobonds reduce borrowing costs but also lack procurement reform or supply-chain guarantees, limiting their impact.
- The ERB is stronger, enforcing pooled procurement and reducing duplication, but leaves SME liquidity issues unresolved.
- The DSRB integrates both sovereign finance and supply-chain guarantees, giving the supply side a chance to adapt thus sustaining growth impacts over the decade.
4.2 What This Means
Looking at both perspectives together shows why structure matters. The 1% GDP lens illustrates the inherent weakness of defence multiplier effects alone — they are often less than one. The scaled model lens shows how the ERB and especially the DSRB change the game, by converting relatively small sovereign contributions (0.3–0.5% of GDP) into large financing envelopes that raise GDP and GVA not just temporarily but persistently.
Put simply: the literature suggests that without a multilateral structure, increases in defence spending risk being fiscally costly and economically sub-optimal. This is because a multilateral solution allows the supply side to adjust, reducing the dependency on imports and enabling key multipliers through the spillover effects of R&D and supply chain efficiencies.
5. Conclusion
This note has tested the idea that the structure of defence spending matters more for GDP and GVA than the volume of spending itself. The evidence strongly supports that claim.
If we just look through a standardised lens of a 1% of GDP one-off-spending shock, the results are modest: multipliers of 0.4–0.8 in the short run, fading toward zero in the medium term, and only turning positive over a decade if spending is directed to domestic procurement, R&D, or dual-use innovation. In other words, without structure, increases in defence budgets may add to security but do little to boost economic growth.
By contrast, when we apply the same logic to the scaled financing models now on the table, the results look different. Sovereign contributions of just 0.3–0.5% of GDP to a multilateral bank can be leveraged into financing envelopes worth 5–10% of GDP. When those funds are channelled through conditional procurement and extended to the full depth of the supply chain, the effective multipliers are larger and, crucially, more persistent. The DSRB in
particular sustains GDP/GVA impacts of 1.5–2% in the central case and up to 3–4% under ambitious assumptions over a decade. This latter model is arguably more realistic than a “shock” based metric because increases in defence spending across NATO countries to 5% of GDP will persist meaning that this is an opportunity for defence supply chains to adjust permanently reducing reliance on imports.
Thus, the conclusion is not that defence spending is a growth strategy in itself. Yet as countries that have been plagued by sluggish economic growth in recent years, this is an opportunity missed. The literature overview and stylised modelling presented here suggest that well-structured defence finance can turn a security necessity into a significant contributor to long-run economic performance.
Limitations
This is a briefing note to begin the process of understanding GDP multipliers of multilateral defence financing. As such it is intended to start a conversation because at this early stage, its use and interpretation have several limitations not least of which is the fact that the ERB and DSRB results in particular are based on assumptions about government financing allocations provided by the organisations themselves rather than external research on collective defence finance. In addition there are a few elements of the research to consider as follows:
- First, multiplier estimates are always imprecise and sensitive to assumptions about monetary policy, openness, and financing method.
- Second, historical studies are based largely on U.S. or European data; applying them to today’s defence build-up across NATO and its partners may require different modelling approaches.
- Third, modelling the ERB and DSRB relies on projected capitalisation and leverage ratios that may shift with market conditions or political choices.
- Finally, growth effects depend on how procurement is actually implemented: without genuine reform and supply-chain inclusion, even the best-designed financial institution may underperform.
Further research should therefore focus on three areas.
- Micro-level supply chain analysis. We need better data on Tier 2–4 defence suppliers, especially SMEs, and how access to finance changes their capacity to scale.
- Comparative institutional modelling. A proper counterfactual assessment of SAFE, Bruegel, ERB and DSRB using dynamic CGE or DSGE models would sharpen the estimates presented here.
- Long-run productivity impacts. The most important unanswered question is how much dual-use R&D financed through these models feeds into wider innovation
systems, raising productivity beyond the defence sector. Existing studies suggest that sustained increases in defence R&D can raise long-run productivity by around 0.25 percentage points per year, with potential cumulative GDP uplifts of 1–2% after a decade if procurement is geared toward high-technology and dual-use capabilities. Preliminary indications not including in this paper because they require further testing suggest that under ambitious assumptions, crowd-in and spillovers could sustain GDP levels 3–4% above baseline after ten years, with corresponding gross value added (GVA) gains spread into advanced manufacturing, cyber, and critical infrastructure sectors.
These estimates should not be read as forecasts, but as indicative orders of magnitude. They provide a framework for future investigation: to test systematically how multilateral defence finance influences innovation spillovers, regional industrial ecosystems, and long- run competitiveness across NATO economies.
Bibliography
Defence Finance and Economic Factors
- Barro, R. and Redlick, C. (2011) ‘Macroeconomic effects of government purchases and taxes’, Quarterly Journal of Economics, 126(1), pp. 51–102.
- Ramey, V. and Zubairy, S. (2018) ‘Government spending multipliers in good times and in bad’, Journal of Political Economy, 126(2), pp. 850–901.
- Becker, D. and Dunne, P. (2023) ‘Components of defence expenditure and growth’, Defence & Peace Economics.
- Olejnik, A. (2023) ‘Military expenditure multipliers in Central and Eastern Europe’, Journal of Comparative Economics, 51(3).
- SUERF (2025) Buy guns or roses? Fiscal multipliers of defence spending in the EU. SUERF Policy Note No. 372.
- Moura, A. (2015) Fiscal multipliers and endogeneity bias. Toulouse School of Economics Working Paper.
- Geli, J. and Moura, A. (2023) The gritty of fiscal multipliers. IMF Working Paper.
- Dudzevičiūtė, G. (2023) ‘Does the funding of the defence sector depend on economic factors in the long run? The cases of Estonia, Latvia, and Lithuania’, Public Policy and Administration, 22(3), pp. 267–277. doi:10.5755/j01.ppaa.22.3.34022.
Multilateral Development Banks and DFIs
- Sithole, M.S. and Hlongwane, N.W. (2023) The role of the New Development Bank on economic growth and development in the BRICS states. MPRA Paper No. 119958. Munich: Munich Personal RePEc Archive.
- Hofman, B. and Srinivas, P.S. (2024) ‘The New Development Bank and its evolving role in the global financial architecture’, Global Policy, 15, pp. 451–457. doi:10.1111/1758-5899.13389.
- Massa, I. (2011) Impact of multilateral development finance institutions on economic growth. London: Overseas Development Institute.
- Köstem, S. and Metintaş, M. (2024) ‘Financing connectivity in Eurasia: The role of multilateral development banks’, Eurasian Studies, 15(3), pp. 51–72.
- Haini, H. (2020) ‘Examining the relationship between finance, institutions and economic growth: evidence from the ASEAN economies’, Economic Change and Restructuring, 53, pp. 519–542. doi:10.1007/s10644-019-09257-5.
- Evans, J.W. and Davies, R. (eds.) (2015) Too global to fail: The World Bank at the intersection of national and global public policy in 2025. Washington, DC: World Bank.
- Joint MDB Task Force (2023) Mobilization of private finance by MDBs and DFIs: 2023 joint report. Washington, DC: World Bank Group and partner MDBs.
- European Bank for Reconstruction and Development (EBRD) (2024) EBRD impact report 2024. London: EBRD.
Comparative Financing Models (SAFE, Bruegel, ERB, DSRB)
- Harding, R. (2025) Financial model v3: DSRB financial returns model. London: Centre for Economic Security.
- Murray, R., Harding, R., Peach, S. and Boyd, R. (2025) Powering growth, strengthening security: The Defence Funding Solution (DSR Bank 2-pager). London: CES/DSRB.
- de Selliers, G., Carter, N. and Lucas, E. (2025) The European Rearmament Bank: FAQ v17 Concept Paper. Brussels: ERB.
- Centre for Economic Security (2025) Towards a defence spending model. Tunbridge Wells: CES.
- Centre for Economic Security (2025) Military supply chains and supply chain finance. London: CES.
- ITFA and Centre for Economic Security (2025) Managing compliance in defence and military goods financing. London: ITFA.
- Centre for Economic Security (2025) Collective defence finance: background and comparative models (SAFE, Bruegel EDM, ERB, DSRB). London: CES.
R&D and Supply Chain Effects
- OECD (2014) Measuring the spillovers from defence R&D into civilian applications. Paris: OECD Publishing.
- Ruttan, V. (2006) Is war necessary for economic growth? Military procurement and technology development. Oxford: Oxford University Press.
- Hartley, K. (2012) The economics of defence policy: A new perspective. Abingdon: Routledge.
- Kiel Institute for the World Economy (IfW) (2025) Guns and growth: The economic consequences of surging defence spending. Kiel Policy Brief.
Appendix 1. Country and Regional Breakdown
The growth and GVA effects of defence spending depend heavily on national fiscal space, industrial structure, and supply-chain resilience. To illustrate this, the table below compares two scenarios for each major NATO and partner economy:
1. Central case, 1% GDP spending shock – benchmarked from the multiplier literature (≈+1.0–1.4% GDP in the short run, fading to ≈+1.5% by year 5, ≈+2% at 10 years). 2. Central case, DSRB-structured investment – using actual scaled sovereign contributions (≈0.3–0.5% GDP capitalised and leveraged to ≈8–10% GDP finance by year 5), with MDB persistence and spillovers (+1.5–2.0% GDP by year 5, +2–4% at 10 years).
| Country / Region | Central 1% GDP spending shock (short/med/long) | DSRB investment effect (short/med/long) | Notes |
|---|---|---|---|
| Germany | +1.2% / +1.5% / +2.0% | +1.5% / +2.0% / +3–4% | Strong industrial base; fiscal rules suspended. |
| France | +1.0% / +1.5% / +2.0% | +1.5% / +2.0% / +3% | Primes strong; DSRB helps SMEs and innovation. |
| Italy | +0.8% / +1.0% / +1.5% | +1.2% / +1.5% / +2–3% | High debt; equity treatment of DSRB crucial. |
| UK | +1.0% / +1.5% / +2.0% | +1.5% / +2.0% / +3% | London finance hub; DSRB boosts SME liquidity. |
| US | +1.0% / +1.5% / +2.0% | +1.2% / +1.5% / +2% | Already scaled; MDB benefits allies more than itself. |
| Japan | +0.8% / +1.2% / +1.5% | +1.2% / +1.5% / +2–3% | High debt ratio; MDB avoids worsening optics. |
| Australia | +0.9% / +1.3% / +1.5% | +1.2% / +1.5% / +2–3% | Thin industrial base; DSRB crowds in domestic suppliers. |
| Canada | +0.9% / +1.3% / +1.5% | +1.2% / +1.5% / +2–3% | Supply-chain dependence on US; MDB spreads risk. |
| Nordics | +0.8% / +1.0% / +1.5% | +1.2% / +1.5% / +2–3% | Small open economies; MDB prevents import leakage. |
| EU (collective) | +1.0% / +1.5% / +2.0% | +1.5% / +2.0% / +3% | €800bn planned; MDB ensures coherence, avoids duplication. |
| NATO (overall) | +1.0% / +1.5% / +2.0% | +1.5% / +2.0% / +3–4% | Collective 5% GDP pledge; pooled finance raises persistence. |
Interpretation
- In the 1% spending shock scenario, effects are positive but modest, and fade unless procurement is innovation-heavy.
- Under the DSRB scenario, the same sovereign contributions unlock larger financing envelopes, extend liquidity into SMEs, and sustain effects into the long run.
- Countries with high debt burdens (e.g. Italy, Japan) gain most from the equity-asset treatment of contributions. Small open economies (Nordics) gain by reducing import leakage.
- Collectively, NATO achieves not only higher short-run GDP gains but also longer-term productivity spillovers when structured through the DSRB.
Appendix 2. Growth methodology in detail
How Growth Assumptions Were Applied in the Model
The modelling approach combined empirical multiplier estimates from the literature with the financing structures of the proposed defence banks to give estimates economic growth.
- Baseline multipliers from the literature. o From Barro & Redlick (2011), Ramey & Zubairy (2018), Becker & Dunne (2023), Olejnik (2023), SUERF (2025) and others, we extracted central estimates of fiscal multipliers. o For a +1% of GDP defence spending shock, the short-run effect is taken as approx. 0.4–0.8% GDP, central case approx. 1.0–1.4% when procurement is domestic and capital-intensive. o Medium-run effects (3–5 years) were based on IMF and OECD evidence that public investment multipliers rise over time to 1.3–1.9, with persistence when tied to infrastructure and R&D. o Long-run (10 years) effects included productivity spillovers estimated at approx. 0.25 percentage points per year from dual-use innovation, consistent with OECD and Ruttan (2006).
- Adjustment for financing structures. o SAFE and Eurobond models were treated as spending or debt, so multipliers were applied directly to the nominal spending increases. o ERB and DSRB were treated as investments, not spending. Here, sovereign contributions of 0.25–0.5% of GDP were scaled by leverage ratios (20–25×), giving effective lending envelopes of 5–10% of GDP. o To these larger flows, the same multiplier ranges were applied — but with persistence adjusted upwards to reflect MDB evidence of crowd-in and long- term mobilisation (Massa, 2011; Joint MDB Report, 2023; EBRD, 2024).
- Scenario construction. o For each horizon (short, medium, long), we produced three cases: § Conservative — low-end multipliers, import-heavy spending, little mobilisation. § Central — average multipliers with partial procurement reform and MDB-style leverage. § Ambitious — high multipliers, strong domestic content, R&D-heavy procurement, full DSRB mobilisation. o These cases were expressed as GDP level effects relative to baseline (e.g. +1.5% after 5 years in the central ERB case, +3–4% after 10 years in the ambitious DSRB case).
- Country and regional breakdown. o The same multipliers were applied to each economy, but adjusted qualitatively for fiscal position (e.g. Italy’s debt optics, Germany’s suspended debt brake), openness (Nordics vs. U.S.), and industrial depth (France vs. Australia). o This allowed us to compare the impact of 1% GDP shocks vs. scaled DSRB/ERB contributions in each national context.
Multiplier ranges from the defence and MDB literature were used as the coefficients for the model then scaled according to the financing envelopes and structures of the SAFE, Bruegel, ERB, and DSRB models. The combination of multiplier × financing volume × persistence assumptions is what generated the short-, medium-, and long-run GDP/GVA projections in the results tables.